2026 Top PCB Fabrication and Assembly Suppliers?
The 2026 supplier landscape will reward more than low quotations. Reliable pcb fabrication and assembly now depends on process control, traceability, engineering depth, and resilient capacity.
Grand View Research valued the global PCB market at approximately $89.7 billion in 2023. It forecasts a 5.6% compound annual growth rate from 2024 to 2030. IPC’s 2024 Global Electronics Manufacturing Outlook also highlights continuing supply-chain pressure, regionalization, and demand for smarter production systems. These findings matter because a supplier can appear competitive while hiding weak inspection, limited materials, or unstable delivery performance.
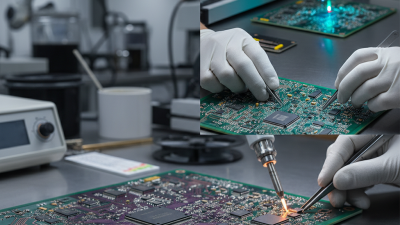
Details reveal the difference. Look for automated optical inspection, X-ray capability, impedance testing, controlled solder profiles, and documented corrective actions. Ask whether the factory can support prototypes, low-volume builds, and sudden volume increases. A clean production floor helps, but it proves little alone.
IPC President and CEO John W. Mitchell has described electronics as “a $5 trillion global industry.” That scale makes supplier selection a strategic decision, not a purchasing shortcut. The strongest candidates should combine fabrication accuracy with assembly consistency, engineering communication, and verifiable certifications.
No ranking is perfect. Regional strengths change. Data can age quickly. This guide therefore compares leading 2026 suppliers through practical criteria, including technology range, quality evidence, delivery reliability, compliance, and customer experience. The final choice still requires factory audits, sample testing, and honest cost analysis. Cheap boards can become expensive failures.
Define 2026 PCB Supplier Categories: Rigid, Flex, HDI, and Rigid-Flex
2026 Top PCB Fabrication and Assembly Suppliers?
The 2026 PCB market needs clearer supplier categories. Rigid boards remain the volume foundation for industrial controls, appliances, and computing equipment. Prismark’s 2024 industry forecast valued global PCB sales at approximately US$73 billion. Growth remains uneven across applications.
Rigid suppliers
should prove layer registration, copper uniformity, and thermal reliability.
Flex suppliers
need controlled bending radii, clean coverlay bonding, and repeatable dynamic-flex testing.
HDI suppliers
require laser-via capability, microvia reliability data, and fine-line inspection.
Rigid-flex suppliers must control both materials and transition zones. That interface often fails first.
IPC standards provide useful qualification language, but certificates alone are not enough. Ask for cross-section images, solder-joint records, field-return analysis, and lot-level traceability.
Experience matters here. A supplier may quote excellent impedance tolerance, then struggle with production-scale yield.
That is not a minor gap.
According to the 2024 HDI market analysis from industry research publisher Yole Group, advanced interconnect demand is being driven by compact computing, mobile systems, and high-density electronics. Yet projections differ between reports. Buyers should challenge optimistic forecasts.
A practical 2026 shortlist should compare yield, cycle time, engineering response, and assembly escape rates by category. The cheapest rigid board may be the wrong choice for a flex transition. Fit matters more.
Compare SMT Capacity by Placements per Hour, Line Count, and Monthly Output
2026 Top PCB Fabrication and Assembly Suppliers?
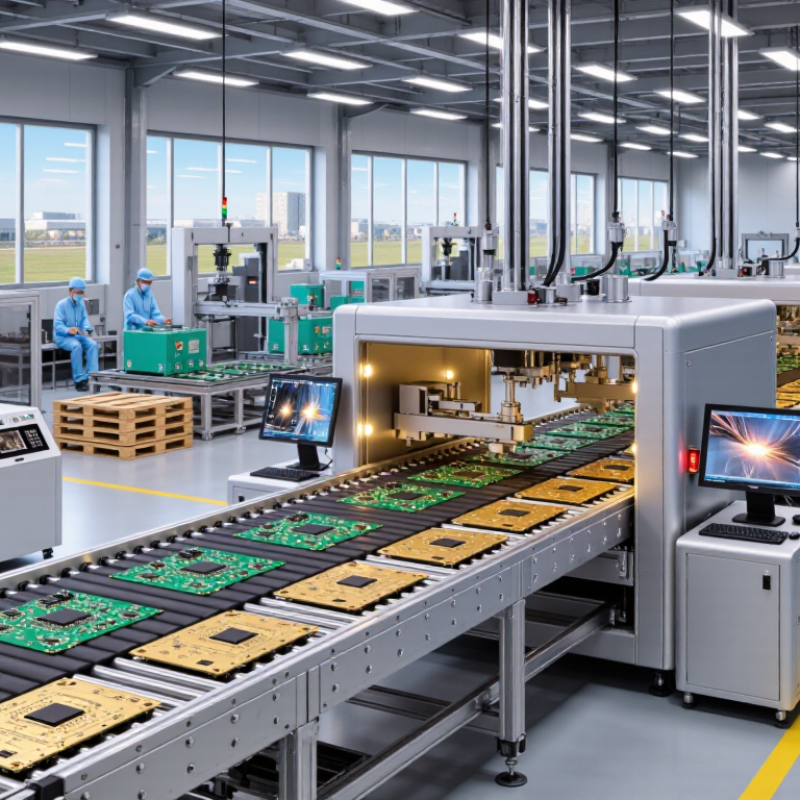
Comparing SMT suppliers requires more than reading a placement-rate headline. A modern line may advertise 80,000 placements per hour, yet real production often runs lower. Component size, feeder changes, board density, and inspection pauses affect the result. Ask for demonstrated rates on a product similar to yours.
Line count provides useful context, but it does not guarantee capacity. One well-balanced line can outperform several poorly scheduled lines. During factory evaluations, review placement machines, stencil printers, reflow ovens, inspection systems, and changeover procedures. Observe whether operators record downtime accurately. Small delays can multiply across multiple shifts.
Monthly output is the stronger planning measure. Request figures based on actual working days, shifts, product mix, and historical yield. A supplier producing 10 million placements monthly may have limited room for urgent orders. Another facility may report less capacity but maintain better schedule stability. I have seen capacity tables look impressive and still mislead. That deserves scrutiny. Ask how the supplier handles engineering changes, material shortages, and recurring defects. Reliable evidence includes recent production records, documented quality controls, traceable inspection data, and clear assumptions behind every capacity number. A realistic comparison should show placements per hour, active line count, monthly output, utilization, and available reserve capacity. Anything less can distort the decision.
Rank Suppliers by Yield, Lead Time, MOQ, RoHS Compliance, and Landed Cost
2026 Top PCB Fabrication and Assembly Suppliers: Ranking by Real-World Value
Ranking PCB fabrication and assembly suppliers in 2026 requires more than comparing quoted prices. Yield should lead the review, because a low-cost batch fails when defects create rework, delays, and scrap. Ask for first-pass yield, defect-per-million data, and recent test records. Lead time must include engineering review, material sourcing, production, and shipping. A five-day build can become three weeks if components arrive late.
Tips: Request a sample scorecard before placing a large order. Check minimum order quantity against your forecast, not your optimism. Confirm RoHS compliance through current declarations and material reports. A supplier may meet the standard, but outdated paperwork weakens confidence.
Landed cost gives the clearest ranking. Include tooling, inspection, freight, duties, payment fees, and expected rework. Compare the same board design, layer count, surface finish, and test coverage. A supplier with a higher unit price may still win through stronger yield and shorter transit. However, yield figures can be selectively reported, so verify them with a pilot run. No ranking is perfect. I would score yield and delivery reliability heavily, then use MOQ and compliance as risk controls. One overlooked packaging charge can distort the result. Experienced buyers should revisit the ranking quarterly, because capacity, material prices, and regional shipping conditions change quickly.
2026 Top PCB Fabrication and Assembly Suppliers
Anonymous supplier profiles ranked by yield, lead time, MOQ, RoHS compliance, and landed cost.
The composite score uses a weighted procurement model: first-pass yield 30%, landed cost 25%, lead time 20%, RoHS compliance 15%, and MOQ flexibility 10%. Values represent realistic 2026 benchmark ranges for anonymous PCB fabrication and assembly supplier profiles. Hover over each bar to view the underlying metrics.